It is, of course, not news that variability has a tremendous impact on supply chain performance. By the 1980s and ‘90s, the negative consequences of supply chain performance variability were already a key driver behind Total Quality Management and 6σ (Six Sigma) movements, with new statistical methods being popularized in an attempt to better quantify that variability (and therefore help to mitigate its effects).
When statisticians measure variability, very often you encounter one of the following metrics:
- Range: The range is the difference between the largest and smallest values in a dataset. It is easy to calculate and understand but it is sensitive to outliers and does not take into account the distribution of values within the dataset.
- Interquartile range (IQR): The IQR is the difference between the third quartile and the first quartile of a dataset. It is more resistant to outliers than the range but it is still sensitive to the presence of extreme values.
- Variance: The variance is a measure of how spread-out the values in a dataset are. It is calculated by taking the sum of the squares of the differences between each value and the mean of the dataset, and then dividing by the number of values in the dataset. The variance is useful for comparing the spread of different datasets but it can be difficult to interpret because it is in units that are squared.
- Standard deviation: The standard deviation is the square root of the variance, and it is a measure of how spread out the values in a dataset are. It is easier to interpret than the variance because it is in the same units as the original data. However, it is still sensitive to outliers and can be affected by the presence of extreme values.
- Coefficient of variation: The coefficient of variation is the standard deviation divided by the mean of a dataset. It is a measure of the relative spread of a dataset and is useful for comparing the spread of datasets with different units or means. However, it does not take into account the shape of the distribution and can be affected by the presence of extreme values.
- Confidence intervals: Confidence intervals are a way to estimate the range in which a population parameter is likely to fall. They are typically constructed by calculating a sample statistic (such as the mean or median) and then adding and subtracting a margin of error based on the standard error of the statistic and the desired level of confidence. Confidence intervals can be used to quantify the uncertainty associated with an estimate and to compare the precision of estimates from different samples.
→ While these are very useful measures to describe the inputs to your supply chain environment, they may not necessarily be sufficient to describe the performance of your supply chain.
While these traditional metrics offer some insight into statistical behaviors, supply chain performance is the result of complex interactions between many sources of variability/uncertainty and so basic methods can only ever provide guidance, rather than genuine insights into real world events. That’s why more advanced methodologies must be employed to deliver greater value, including:
- Bootstrapping: This is a resampling technique that can be used to estimate the sampling distribution of a statistic. It involves repeatedly drawing random samples with replacement from a dataset and calculating a statistic of interest for each sample. The resulting distribution of statistics can be used to construct confidence intervals, to perform hypothesis tests or as an input for Monte Carlo simulations.
- Monte Carlo simulation: This is a computational technique that involves generating random samples from one or more probability distributions in order to estimate some quantity of interest. They can be used to explore the uncertainty associated with different assumptions or models and to compare the outcomes of different scenarios.
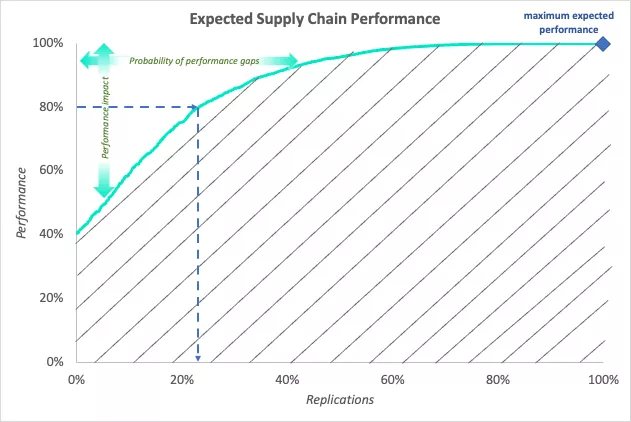
Monte Carlo simulations are instrumental in creating expected performance graphs and their related “area under the curve” (AUC) metric. While AUC has its origin in the machine learning community, the idea has been adapted to give a clear insight in the probabilistic behavior of supply chain performance.
The traditional AUC curve is one of the most important evaluation metrics for checking any classification model’s performance. It maps the false positive rate on the X-axis versus the true positive rate on the Y-axis, and the AUC is then calculated by finding the area under this curve. This is done by approximating the curve using a series of straight line segments and summing the area of the resulting trapezoids. The higher the AUC, the better the performance of the classifier.
When measuring supply chain performance, we use AUC in a somewhat different way. By normalizing the number of replications of a Monte Carlo simulation on the one hand and creating normalized performance indicators on the other hand, we get a 100% by 100% framework that allows us to map performance per replication in an increasing way, as illustrated in the graph below:
 News
 News